User-friendly AI-based Decision Support Systems
Research Question and Context
How should risk prediction systems present information to decision-makers with limited quantitative skills? I explored this question during Spring 2024 under Dr. Robert Kostin’s direction, focusing on interface design that minimizes cognitive biases and interpretation errors in human-AI interaction.
Study Design and Methodology
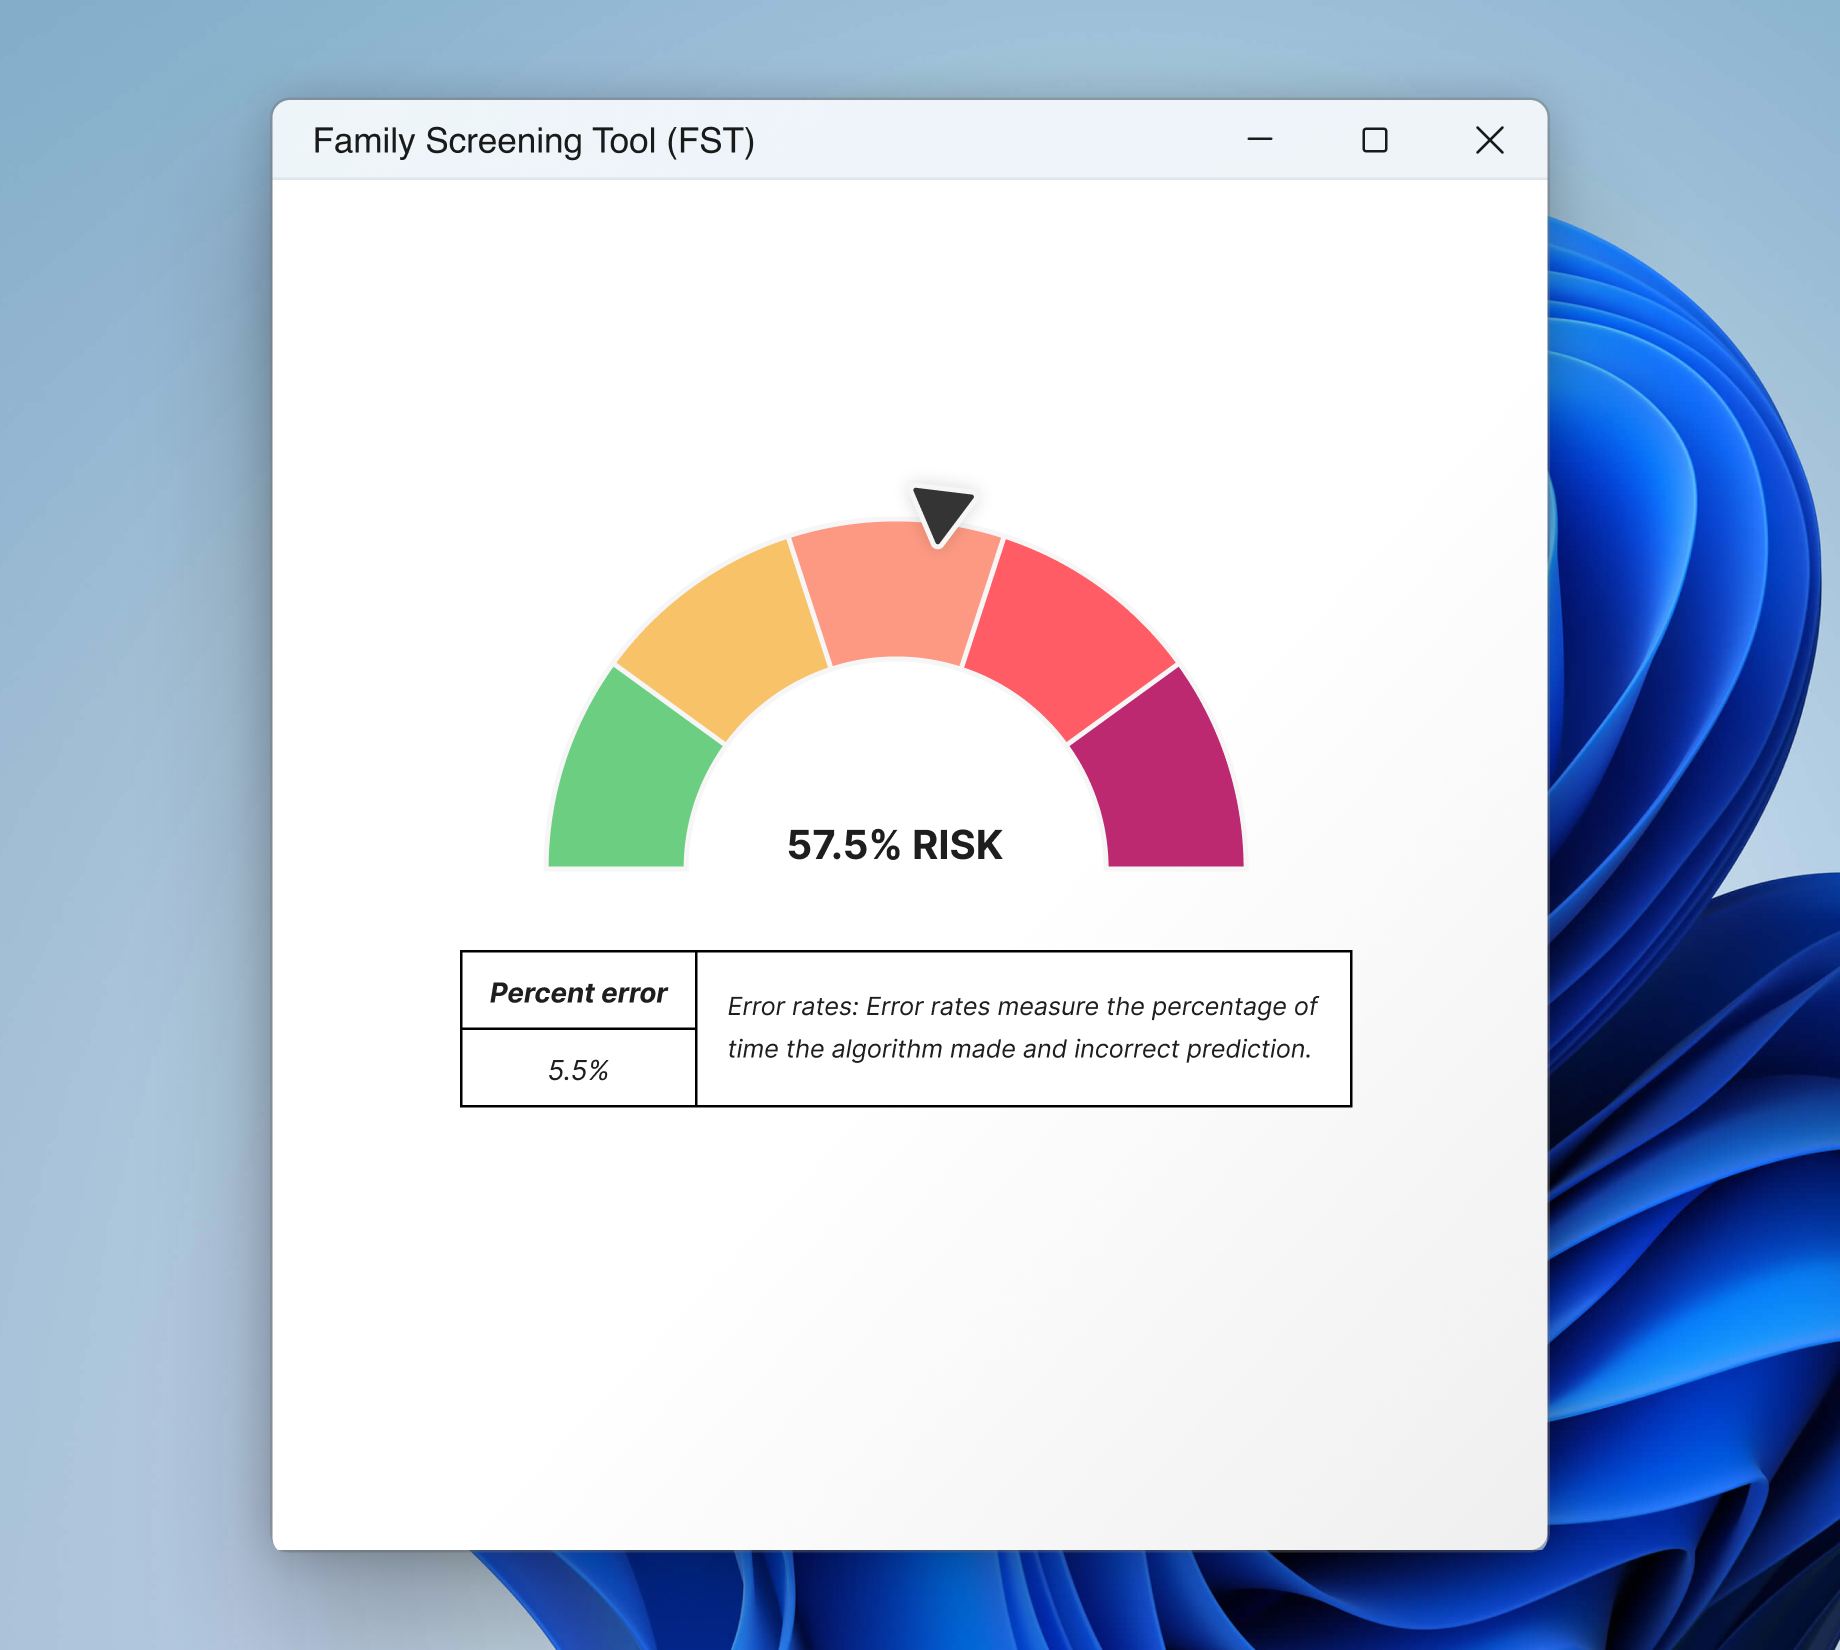
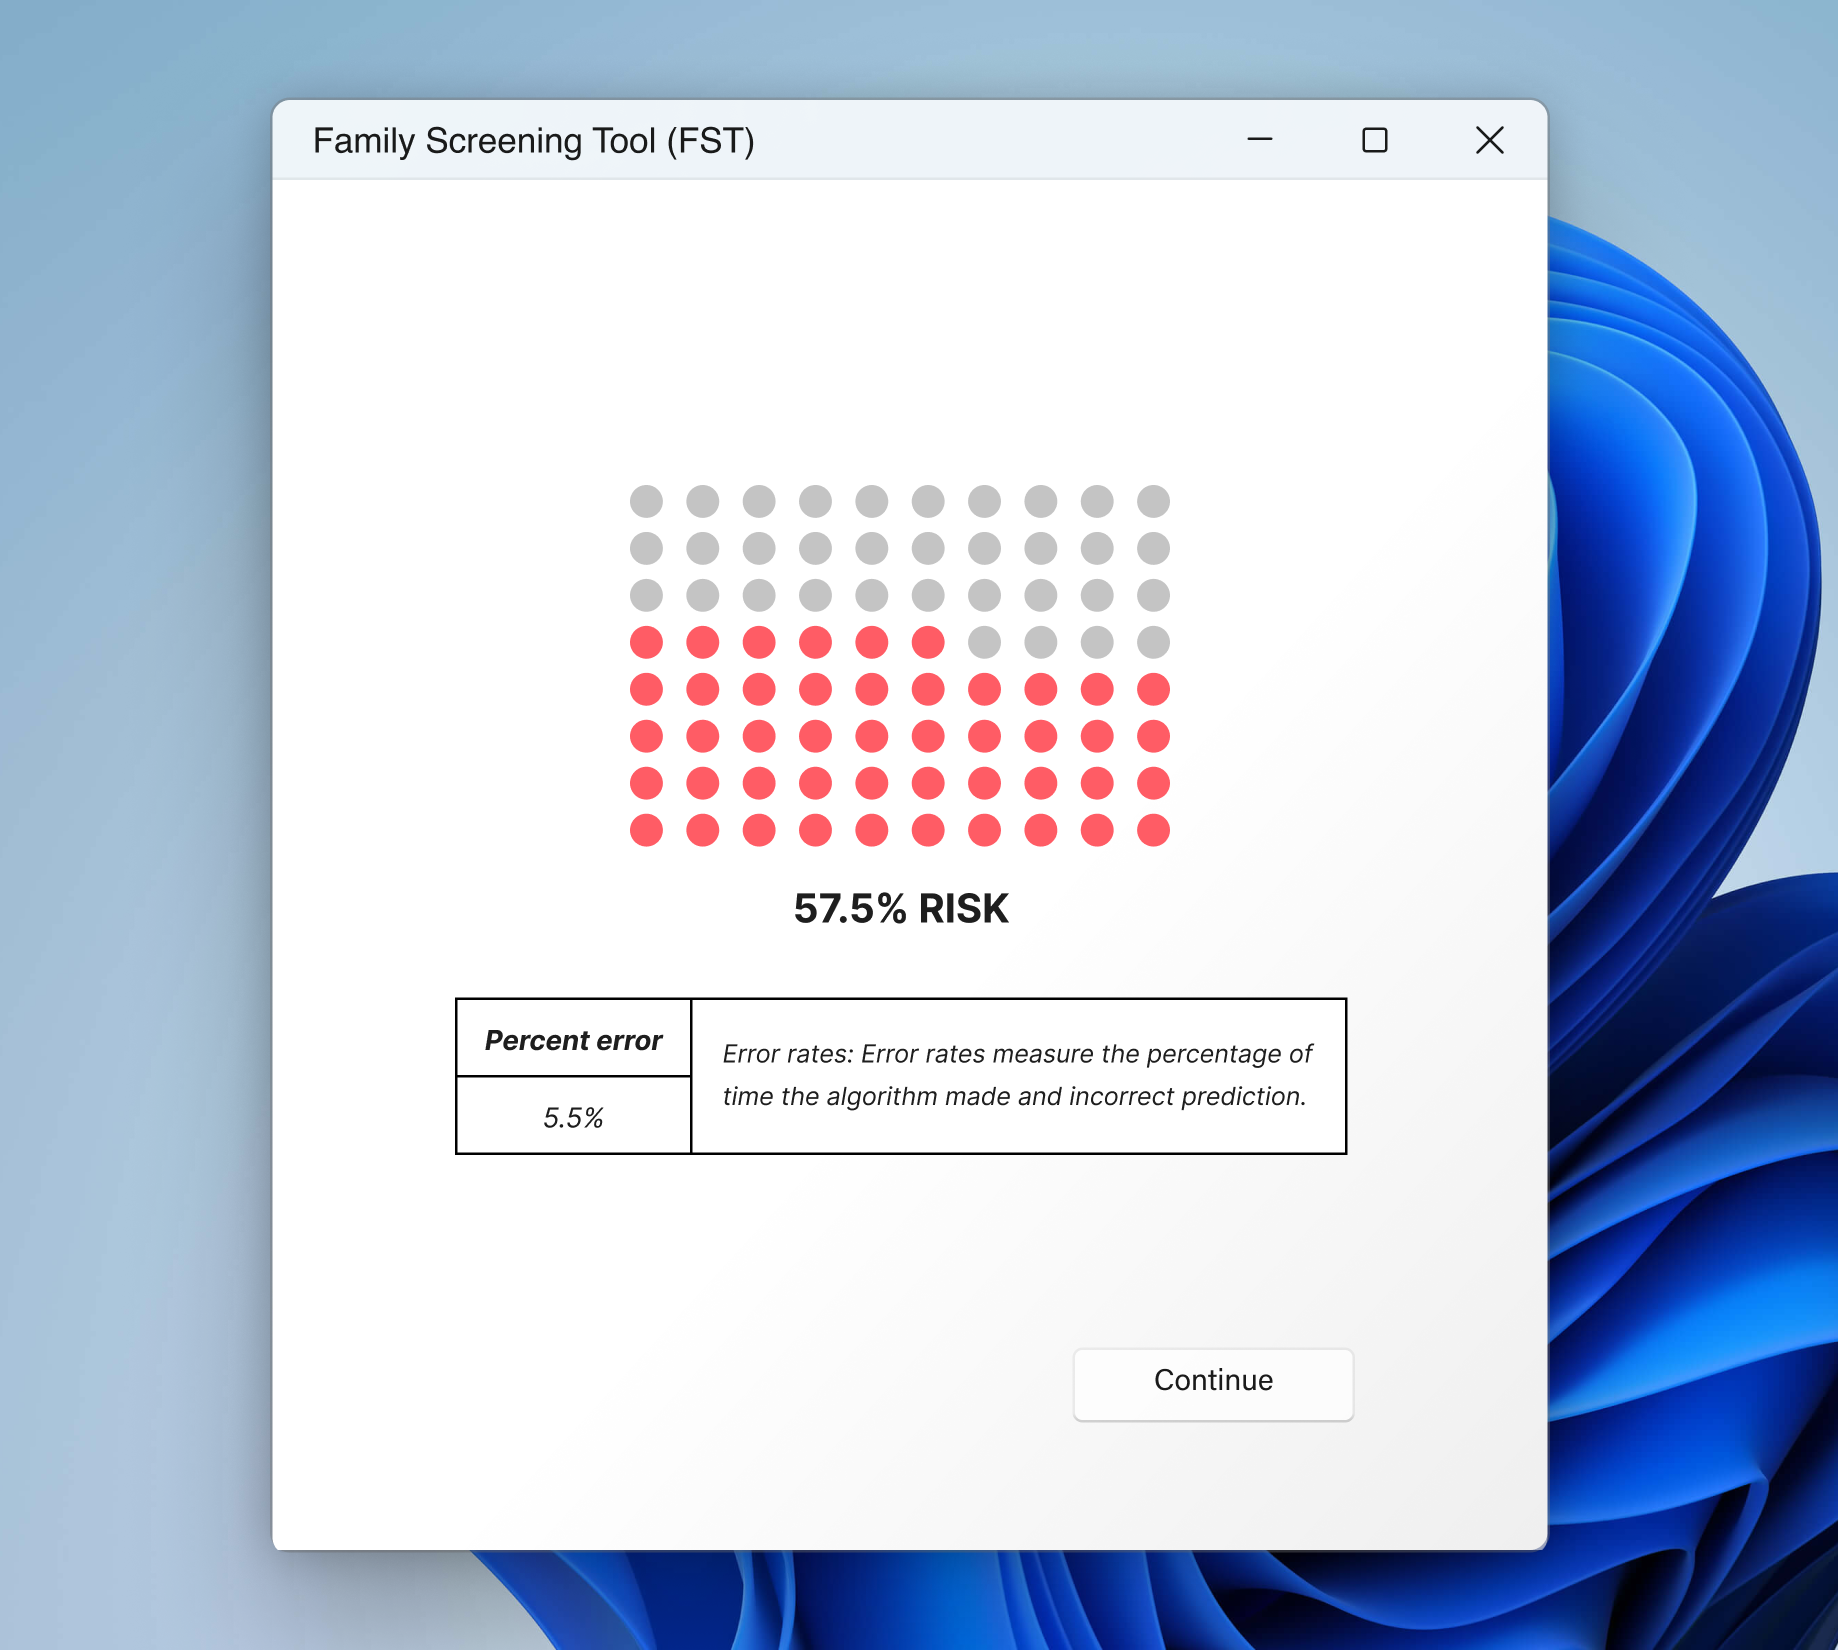
Using the Allegheny Family Screening Tool (AFST)—a system that helps child welfare workers assess family risk—I conducted a pilot between-subjects study with 225 participants to test whether graphical risk prediction widgets influence user decisions. Each participant reviewed a case scenario typical of AFST use and was randomly assigned one of four widget designs: two icon array variants (see Figure 1) and two gauge scale variants (see Figure 2). Participants then classified the case into low, medium, or high risk categories and completed a satisfaction survey about the system.
Hypotheses
- H₀: The graphical risk prediction widget does not influence the user’s decision
- H₁: The graphical risk prediction widget influences the user’s decision
Findings and limitations
The results showed no statistically significant differences in risk classifications across widget types. However, challenges in recruiting participants with social work backgrounds prevent drawing definitive conclusions about real-world applicability. Despite these limitations, the satisfaction survey revealed an intriguing pattern: participants assigned icon arrays reported higher trust in the tool’s prediction accuracy compared to those who used gauge scales.
Future Work
Reducing the design variants to two and conducting contextual interviews with experienced social workers and child protection professionals would strengthen this research. Additionally, examining risk prediction interfaces in other domains could identify design principles that generalize across decision support systems.
Last updated: September 29, 2025